Two credible numbers, published about a year apart, point in opposite directions. In July 2025, METR reported the result of a randomised controlled trial in which experienced open-source developers, working inside their own live repositories, completed their assigned tasks roughly 19% more slowly when they were allowed to use AI tooling [1]. In July 2026, a study of a large-scale Microsoft AI rollout covering tens of thousands of engineers found that adopters merged about 24% more pull requests than comparable peers who had not adopted [7]. Neither result is vendor marketing, and both were produced by people with a professional stake in being right.
There is also a detail attached to the first number that any honest telling of the story has to carry. In February 2026 the METR authors published an update in which they concluded that their own headline estimate had gone out of date and that the follow-up signal could not be trusted [2]. The percentage that circulates in every conference talk is a retired percentage.
None of these numbers tells you whether AI belongs in your delivery process. What they tell you is narrower and more useful: the evidence base is composed of measurements of different things, and the gap between the measurements is much smaller than the gap between what people have decided the measurements mean.
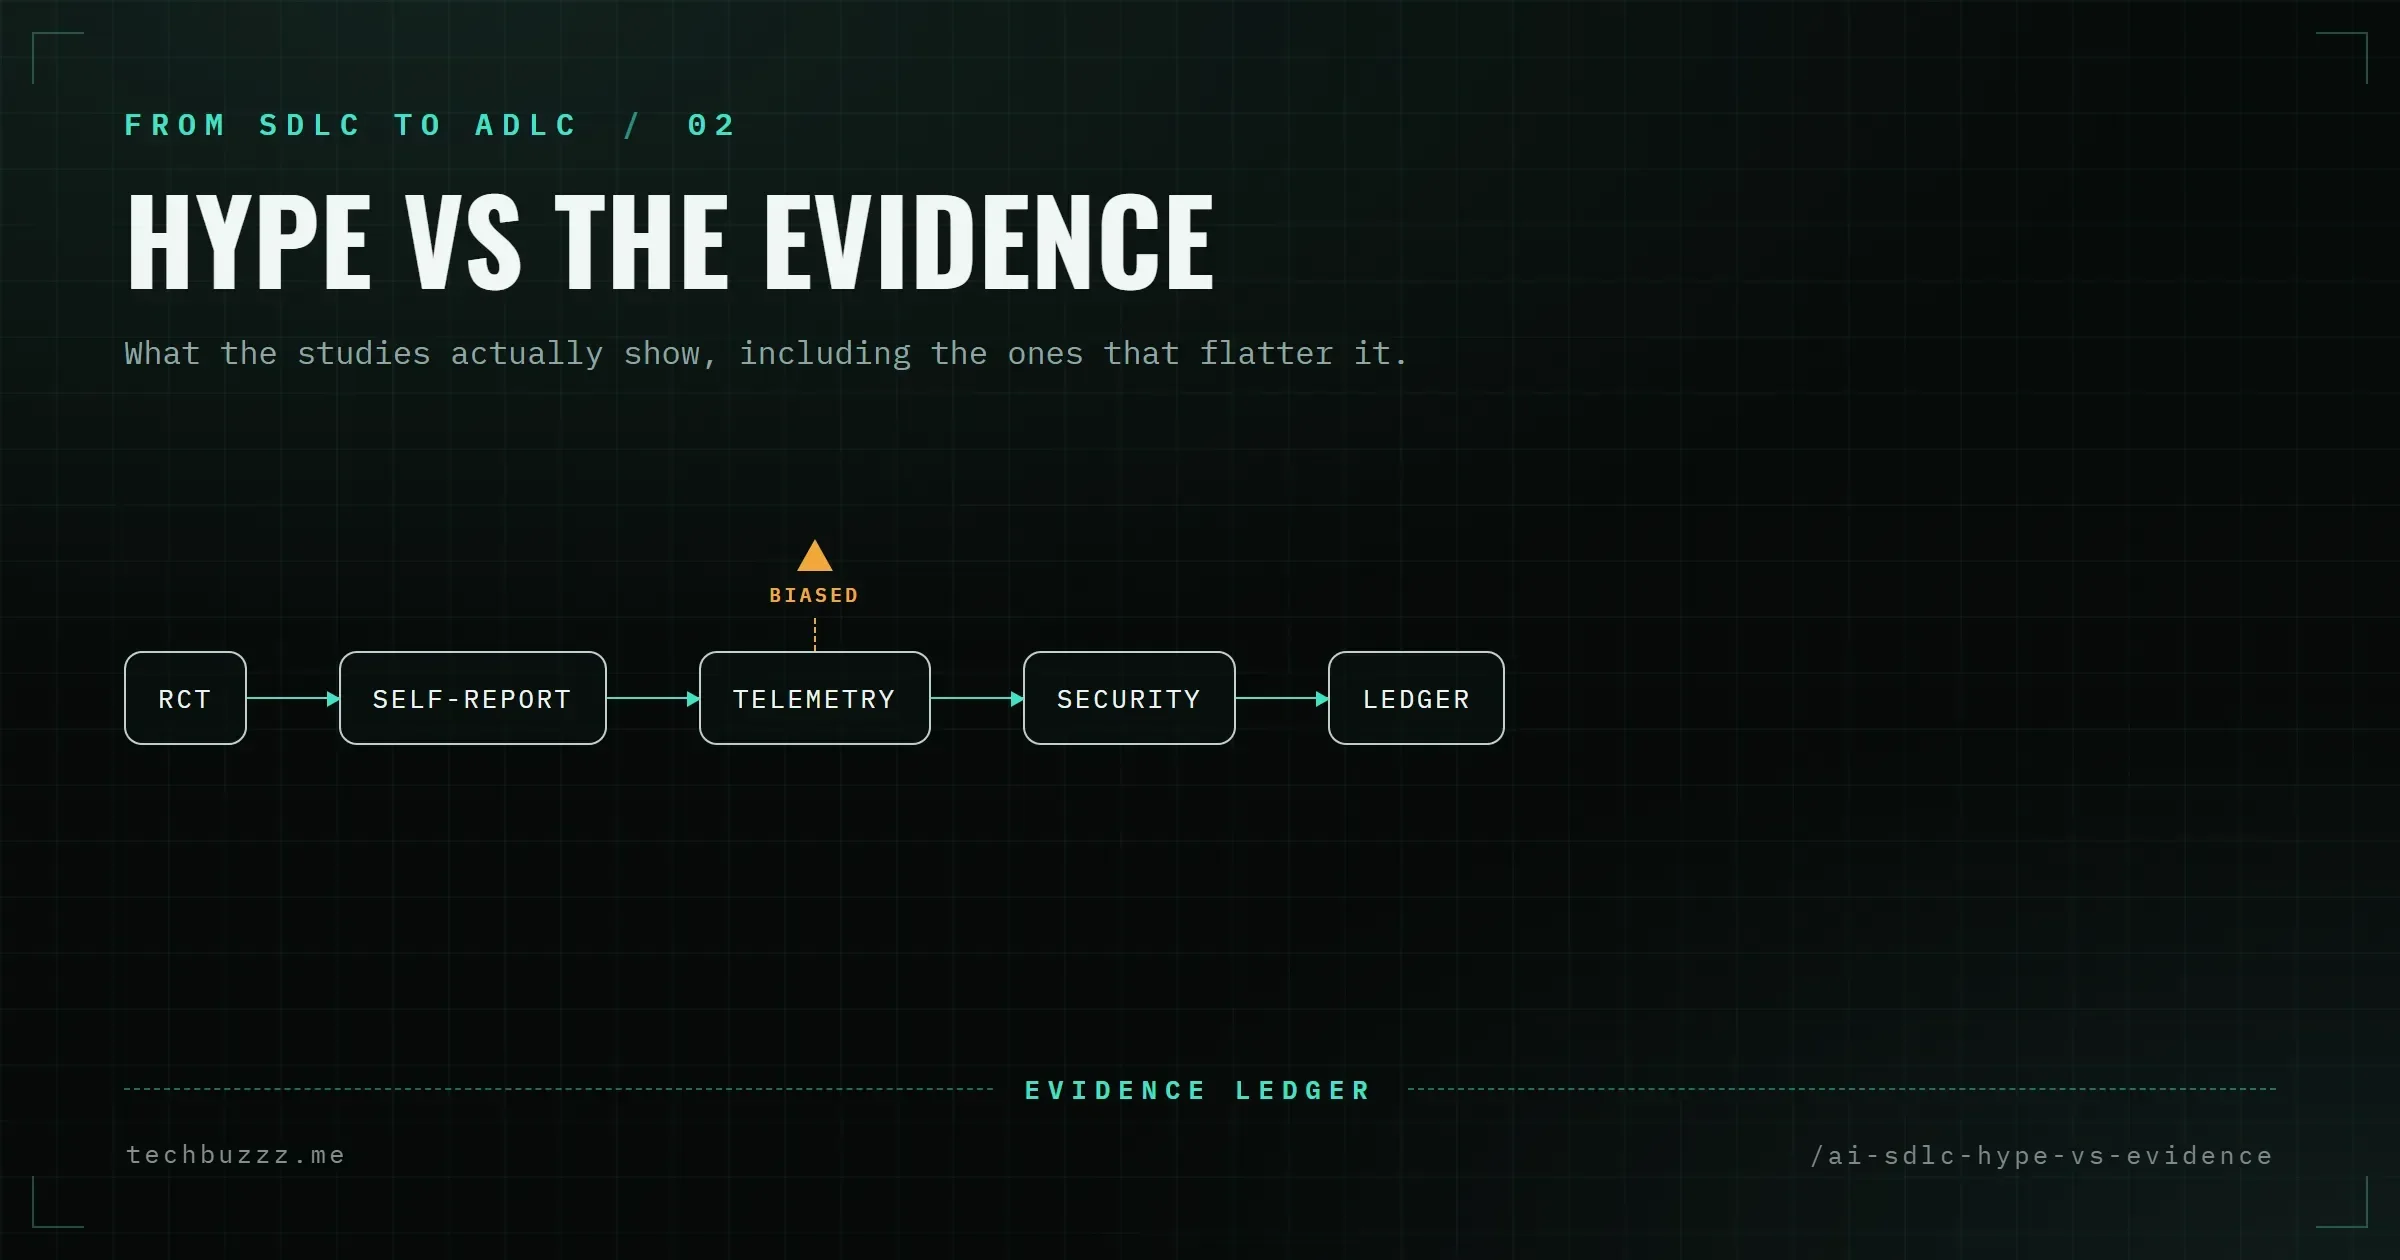
This article is a ledger. It takes the claims genuinely in circulation — speedups, slowdowns, adoption rates, trust levels, security pass rates — and records for each what kind of evidence carries it, what that evidence establishes, and where its authority stops.
Why the numbers disagree before they disagree about reality
A claim about developer productivity is not a single kind of statement. It can be produced by an experiment, by a questionnaire, by a database of merged pull requests, or by a company describing its own internal practice. These are not four estimates of one quantity. They are four different instruments pointed at four different questions, and they fail in four different ways.
The question "which number is true?" is therefore usually malformed. A randomised trial is not a noisier version of a survey. A survey is not a cheaper version of telemetry. When two of them disagree, the first question is not which to believe but which population each was measuring, and on which side of the transaction it was looking.
The families and what each can answer
Randomised trials assign the tool condition and the control condition, measure elapsed time or output quality directly, and can therefore support a causal claim. Their weaknesses are scope and durability. They are expensive, they run on small samples, they measure a narrow slice of work, and the tooling they evaluate is superseded within months. A trial is the strongest instrument available and simultaneously the hardest to generalise from.
Surveys and self-report capture what practitioners believe about their own work. They are cheap, broad and instantly available. They are also biased in a predictable and almost mechanical direction: the people who adopted a tool are the people who answer the survey, and the people who adopted a tool are the people who report it as productive. This is rarely dishonesty. It is the ordinary consequence of asking humans to evaluate a change they have already made, at a moment when abandoning that change would require admitting they were wrong.
Repository telemetry observes what actually passed through the system, at scale, without asking anyone's opinion. It is the only family here that sees the full volume of work rather than a sample, and it measures output that has already been accepted by some form of process. Its characteristic failure is not noise but category error: it counts things. A merged pull request is a count. Whether that pull request reduced incidents, or created a defect that will be paid for next quarter, is not a count, and telemetry will not tell you.
Vendor self-report is a fourth category, and it should be labelled as such in every sentence where it appears. A company reporting its own internal practice is not necessarily wrong. It is, however, reporting from inside a population it selected, using a metric it chose, in a context it optimised for. Frequently quoted in this family is the claim that roughly 75% of new code at one large cloud company is AI-generated and engineer-approved, up from about 50% last fall — a figure that reached the public through secondary press reporting of a primary executive post rather than through a study [18]. It is, by construction, a statement about one company's own codebase, not a finding about software engineering.
Each family answers a different question
The practical discipline is to rewrite every circulating claim as a question before judging it. Did the tool change how long it takes to complete this kind of work? What do practitioners think changed? How much change passed through the system, and what happened to it afterwards? What is the strongest claim the reporter's own data supports?
Under that discipline, most of the loudest disagreements in this field dissolve. The METR trial and the Microsoft rollout are not competing estimates of productivity; one measured task completion time for maintainers working in their own mature codebases, the other counted merged pull requests over four months of production work. They answer different questions, which is why both can be simultaneously true and simultaneously useless for settling an argument in a planning meeting.
Randomised trials
Only one randomised study of this technology has attracted serious scrutiny, and its history is the most instructive single piece of evidence in the field.
The July 2025 METR trial randomised whether AI tools were available during real, live issue-resolution tasks in repositories the participants maintained themselves: 16 developers across 246 tasks [1]. The headline result was that the AI-allowed condition was about 19% slower, while participants predicted they would be 24% faster [1]. That expectation gap is itself a finding — the field has a persistent directional bias in the wrong direction, and any organisation measuring its own rollout should expect reported gains to be higher than observed gains.
The design was unusually credible. The participants were not hobbyists; they were maintainers of the code under modification, which means they could apply their own shortcuts and were accountable for the result. The tasks were real issues rather than synthetic exercises. And the sample is small enough that a careful reader asks about intervals rather than point estimates.
The February 2026 self-correction is the second half of the story, and the half that gets left out. The authors withdrew confidence in the original 19% figure, describing it as outdated and reporting that speedups now seem likely while the follow-up signal is unreliable [2]. Their point estimates were −18% for returning developers, with a confidence interval from −38% to +9%, and −4% for new recruits, with an interval from −15% to +9%; both intervals cross zero, meaning neither result can be distinguished from no effect [2]. They named three reasons for the degradation: developers declined to participate in the tasks where AI was disallowed, which removed exactly the participants most able to benefit from it; hourly compensation fell from $150 to $50, which changed who could afford to spend an afternoon on the study; and the method breaks down when participants run multiple agents concurrently, because the unit of measurement assumes one human driving one tool [2].
That sequence should be read as a model of scientific behaviour rather than as a scandal. The authors audited their own experiment, found it contaminated by its own incentive structure, and published the result. The 19% is now a historical artefact. Anyone citing it in 2026 without the retraction in the same breath is doing precisely the thing this series exists to argue against.
Surveys and self-report
The survey layer is much larger and much more confident. DORA's 2025 State of AI-assisted Software Development, built on roughly 5,000 professionals and more than 100 hours of interviews, fieldwork in September 2025, found that 90% use AI at work, that more than 80% report higher productivity, and that 30% report little or no trust in generated code — in the same study [4]. That combination is the survey family's signature: high confidence about gains and high doubt about the artefact, coexisting without apparent tension in the people reporting both.
The same DORA release reports a positive relationship between AI adoption and delivery throughput alongside a continuing negative relationship with delivery stability [4].
Sonar's 2026 State of Code, based on a quantitative sample of 1,149 respondents, is sharper because it measures the artifact rather than the sentiment: 42% of committed code is AI-generated, 96% of developers do not fully trust it, only 48% always verify before committing, and 38% report that reviewing AI code takes more effort than reviewing a colleague's code [14]. That last figure is the one to carry into a planning session. If reviewing machine-written code costs more human effort than reviewing a colleague's, the organisation has relocated cost, not removed it.
The Stack Overflow Developer Survey 2026, with more than 30,000 participants, records coding assistants and agents as the dominant AI use case (66%) — against 63% for general-purpose LLM chatbots — and 73% of respondents using those tools daily [15]. It also records that only 6.6% trust AI including for important work decisions, and a further 16.3% trust it for many tasks but not for important ones, against roughly 48% who trust it where they can easily verify the output [15]. Adoption and institutional trust are moving in opposite directions, and the distance between them is where the governance work will happen [15]. The same respondents use these systems mainly for familiar code generation (67%) and debugging (61%) rather than deployment, operations or troubleshooting (20%), and they rank quality (75%) above cost (38%) — a ranking coherent only for the 48% who trust output they can easily verify.
Telemetry from real repositories
The telemetry family is where the volume is, and where the interpretive discipline matters most.
The Microsoft rollout study is the largest instrument in the field and the most careful about its own limits. Its authors state plainly that the design is observational rather than randomised and that a merged pull request is a proxy for output, not for delivered value [7]. That single methodological sentence, written by the authors of a strongly positive headline result, is worth more than most of the volume published around it.
Its scale is what makes it useful: tens of thousands of engineers across four months [7]. Its output measure is a roughly 24% increase in merged pull requests for adopters [7] — Claude Code adopters +11.4% [95% CI +9.4%, +13.6%], Copilot CLI adopters +24.9% [95% CI +23.0%, +26.8%]. The paper measures output volume and nothing else, and says so: a merged pull request is a proxy for output, not the value it delivers [7].
The pattern in the telemetry
Read across the telemetry sources and a single pattern emerges, consistent enough that it should be treated as the finding of this generation rather than an anomaly: measures of work produced rise, and measures of what happens to that work afterwards deteriorate.
This is the analytical core, and it is invisible if you stop at any single source. Faros AI's 2026 study, covering 22,000 developers across more than 4,000 teams and comparing low against high adoption within the same organisation, is the sharpest illustration. Teams with high adoption completed 34% more tasks and 66.2% more epics per developer. In the same teams, median time in pull request review rose 441%, bugs per developer rose 54%, incidents per pull request rose 242.7%, pull requests merged with no review at all rose 31.3%, and pull request size rose 51.3% [8]. An organisation can certainly decide that shipping more epics per developer is worth a 441% longer review queue. What it cannot do is report the first column without the second, and the honest version of the claim is that production shifted downstream rather than disappearing.
The earlier Faros AI 2025 wave, with more than 10,000 developers across 1,255 teams, shows the same shape at lower amplitude: 21% more tasks and 98% more merged pull requests, alongside review time up 91%, pull request size up 154%, and bugs per developer up 9% [9]. That the bug figure is modest in 2025 and severe in 2026 is itself worth a hypothesis — either detection lags the rollout, or velocity was bought with less review per change.
The Microsoft longitudinal panel is the most uncomfortable dataset in the field because it shows the review surface shrinking under mandate. The study covers tens of thousands of Microsoft engineers: 461 days before the mandate window and 115 days after it. For adopters, merged pull requests per engineer per day rose 11.4% with Claude Code [95% CI +9.4%, +13.6%] and 24.9% with Copilot CLI [95% CI +23.0%, +26.8%]; with Claude Code used five or more days, the lift reached 50.1% [7]. Volume is rising, and the authors are explicit that they measure a proxy: a merged pull request is not the same as the value it delivers.
The same paper also measures how the lift depends on how long a tool is used: +15.0% for three days of Claude Code use and +50.1% for five or more days [7]. Read this way, the headline merge rate is a measure of work accepted for revision, not work accepted as correct.
LinearB's benchmark, built on 8.1 million pull requests across more than 4,800 teams, puts a hard number on the same mechanism from the other direction: AI-assisted pull requests are accepted within 30 days 32.7% of the time, against 84.4% for unassisted ones [10]. Whatever is happening downstream, it is not a faster path to merged work.
| Study | Population | Output measures | Review and quality measures |
|---|---|---|---|
| Microsoft rollout (observational) [7] | Tens of thousands of engineers, four months | ~24% more merged PRs (95% CI +14.5% to +33.7%) | Claude Code +11.4%, Copilot CLI +24.9%; up to +50.1% with 5+ days of use |
| Faros AI 2026 [8] | 22,000 developers, 4,000+ teams | +34% tasks; +66.2% epics per developer | Review time +441%; bugs per developer +54%; incidents per PR +242.7%; unreviewed merges +31.3%; PR size +51.3% |
| Faros AI 2025 [9] | >10,000 developers, 1,255 teams | +21% tasks; +98% merged PRs | Review time +91%; PR size +154%; bugs per developer +9% |
| LinearB benchmark [10] | 8.1M PRs, 4,800+ teams | — | Accepted within 30 days: 32.7% AI-assisted vs 84.4% unassisted |
| Anthropic internal (vendor self-report) [11] | Internal engineering | Claude authors ~80% of merged code; 8× more code per quarter vs 2021–2025 | Substantive review comments rose from 16% to 54%, with fewer than 1% false positives [19] |
DORA's 2026 return-on-investment report puts a name to the cost side: the J-curve, a temporary productivity dip attributed to the learning curve, the verification tax, and the adaptation of the surrounding pipeline [5]. Its worked example is the kind of number that survives contact with a finance review: $344,000 of negative downtime impact from a change failure rate moving from 5% to 6% [5]. A one-point move in a delivery metric, priced.
Two earlier DORA findings frame the same tension at the level of the whole industry. In the 2024 wave, a 25% increase in AI adoption was associated with a 7.2% reduction in delivery stability and a 1.5% reduction in delivery throughput [3] — an association, in observational data, and worth reading as such. And the tokenmaxxing analysis found that organisations spending the most on tokens obtain only a modest throughput gain at roughly ten times the spend [6]. Ten times the inference budget is not ten times the capability.
The vendor self-report deserves separate handling rather than dismissal. Anthropic states, in its own account, that Claude authors about 80% of merged code and that the company ships eight times more code per quarter than in the 2021–2025 period [11]. That is a self-reported figure about one company and should never be quoted as an industry benchmark. But alongside it there is a measurement rather than a claim, and the measurement is more interesting than the headline: after multi-agent review was deployed into the pipeline, the share of pull requests receiving substantive comments rose from 16% to 54%, with fewer than 1% false positives [11][19]. The mechanism that recovered review coverage was not more reviewers. It was raising the cost of a false accusation inside the review pipeline — the first concrete example in this ledger of infrastructure, rather than capability, moving the number.
The part that has not moved
Two years of capability gains have produced one unambiguous improvement and one unmistakable stagnation. The models got much better at writing code that is well-formed, and they did not get better at writing code that is safe.
The Veracode spring 2026 snapshot tested more than 150 models and found an average security pass rate of about 55%, with cross-site scripting at a 15% pass rate and log injection at 13% [13]. Over the same two-year period, it recorded syntax correctness rising from roughly 50% to roughly 95% while the security pass rate stayed flat [13]. That is the whole finding in one sentence: a near-doubling of syntactic competence moved nothing on the axis that matters.
The Veracode summer 2026 report, testing more than 100 models, found an average security pass rate of 56%, up marginally from 55%, with roughly 44% of tasks producing code containing a known vulnerability [12]. The best model scored 68% and the worst 50% [12]. Specialisation did not help: coding-specialised models scored 51% against 52% for general-purpose ones, and model size did not predict security performance [12]. Language dominated everything else, with Python at 63% and Java at 30%, and the two most common injection classes sat at a 15% pass rate for cross-site scripting and 12% for log injection [12].
| Veracode snapshot | Models tested | Average security pass rate | Cross-site scripting | Log injection |
|---|---|---|---|---|
| Spring 2026 | 150+ | ~55% | 15% | 13% |
| Summer 2026 | 100+ | 56% (from 55%) | 15% | 12% |
One caveat applies to both snapshots and should travel with every citation of them. Veracode tests raw models without agent guardrails, so it measures what the model produces, not what a governed pipeline accepts [12]. That distinction cuts both ways: it explains why the numbers are as low as they are, and it is also the reason they have not moved in two years.
The mechanism behind the stagnation is straightforward. Syntax is machine-checkable, so capability improvements convert directly into measured correctness. Security defects are not machine-checkable without a specification of what the code is supposed to protect, and in most current pipelines that specification does not exist as executable text. The verification effort does not disappear when the model improves at syntax. It relocates into the pull request review queue, where it shows up as the +441% review time [8]. The bottleneck and the flat security curve are the same fact observed from two ends.
How a bad statistic moves a market
The most consequential number in this field is not a productivity figure at all. It is 95%, and the claim attached to it is that 95% of generative AI pilots fail.
The underlying research was an initiative report from the MIT Media Lab's NANDA project [16]. Its evidence base was 52 interviews and 153 survey responses, and it was not peer-reviewed [16]. Its authors were themselves selling agentic AI products [16]. The arithmetic behind the headline was a funnel: roughly 60% of organisations investigated, roughly 20% piloted, roughly 5% deployed successfully [16]. Read carefully, that is a success rate of about a quarter among organisations that actually ran a pilot — measured against an extraordinarily high bar, since almost any enterprise change initiative at scale fails to reach production within the measured window.
The number circulated anyway, and the reason is instructive. It was clean, and apocalyptic, which is the register most likely to be forwarded. It named no vendor, so it could not be dismissed as a competitor's marketing. And it was congruent with an anxiety senior leaders already held, so repeating it cost nothing and confirmed the reader's priors. Fortune ran it prominently, and the critical reading — the one that examines what was actually asked, of whom, and with what response bias — appeared later and travelled far less widely [17].
The methodological lesson is not about MIT. It is about denominator switching. The 95% figure silently changes the base: it measures the whole investigative funnel against the final rung. Under that arithmetic, AI pilots are condemned by a base rate that would condemn any enterprise technology adoption initiative of comparable ambition. A statistic that generalises to everything is a statistic that measures nothing.
The wider pattern is asymmetric circulation. Findings that indict a technology are amplified, because they confirm existing belief. Findings that require caveats — a self-retracted trial, an observational design, a vendor's own measurement of its own codebase — are flattened into confident one-liners, because caveats do not retweet. The countermeasure is not scepticism about AI. It is the discipline of demanding the population, the instrument and the denominator behind every number before allowing it into a planning document.
Evidence ledger
The table below is the closing artefact of this article: every claim used above, its instrument, and the boundary of what that instrument can establish.
| Claim | Source | Type of evidence | What it supports | How far it generalises |
|---|---|---|---|---|
| Developers were ~19% slower with AI, expecting to be 24% faster | METR RCT, July 2025 [1] | Randomised controlled trial | A causal effect on task completion time for experienced maintainers | Retired by the authors in February 2026 [2]; narrow population, small sample |
| Follow-up uplift is unreliable; both intervals cross zero | METR update, February 2026 [2] | Self-correction with audit of the original design | Direction of the effect is not established | Applies to the study's own method under changing incentives |
| 25% more AI adoption associated with −7.2% delivery stability and −1.5% throughput | DORA 2024 [3] | Observational survey of delivery data | Adoption and stability move in opposite directions | Association only; direction of causation not established |
| 90% use AI at work, >80% report higher productivity, 30% report little or no trust | DORA 2025 [4] | Survey plus 100h+ interviews, ~5,000 professionals | Adoption is near-universal; confidence and trust diverge | Self-report; measures belief as much as behaviour |
| Productivity dip is a J-curve caused by learning curve, verification tax and pipeline adaptation | DORA 2026 ROI report [5] | Longitudinal analysis with worked financial example | Early-stage cost is expected and nameable ($344,000 at 5%→6% change failure rate) | Requires the organisation to measure its own change failure rate |
| Highest token spend yields only modest throughput gain | DORA tokenmaxxing [6] | Cross-sectional analysis of spend vs throughput | Inference budget is not linear in capability | Does not identify the spend level where returns flatten |
| ~24% more merged PRs (95% CI +14.5% to +33.7%); Claude Code +11.4%, Copilot CLI +24.9% | Microsoft rollout, arXiv:2607.01418 [7] | Observational rollout study, tens of thousands of engineers | Output volume rose; value per unit of volume was not measured | Merged PR is a proxy for output, not delivered value; not randomised |
| +15.0% merged PRs with 3 days of Claude Code use, +50.1% with 5+ days | Same paper, dose-response [7] | Observational, tens of thousands of engineers | Volume rose while the share accepted without revision did not | Single company; mandate period confounds adoption with policy |
| Claude Code any-use +11.4% (95% CI +9.4% to +13.6%), Copilot CLI +24.9% (95% CI +23.0% to +26.8%) | Same paper, cohort split [7] | Observation | Merge rate is not a correctness rate | One product, one company |
| +34% tasks and +66.2% epics per developer, alongside +441% review time and +242.7% incidents per PR | Faros AI 2026 [8] | Within-organisation low vs high adoption, 22,000 developers | Velocity and downstream load rose together | Vendor-published analysis; observational; adoption is self-selected |
| +21% tasks and +98% merged PRs, review time +91%, PR size +154% | Faros AI 2025 [9] | Cross-sectional, >10,000 developers, 1,255 teams | Same directional pattern one year earlier, at lower amplitude | Different sample and period from the 2026 study; not a trend line |
| AI-assisted PRs accepted within 30 days 32.7% vs 84.4% | LinearB benchmark [10] | 8.1M PRs, 4,800+ teams | Assisted changes reach merge far less often within a fixed window | Acceptance is a proxy; does not distinguish rejection from delay |
| Claude authors ~80% of merged code; 8× more code per quarter | Anthropic [11] | Vendor self-report | What one company states about its own practice | Not independent measurement; must not be used as an industry benchmark |
| Substantive review comments rose from 16% to 54% | Anthropic [19] | Vendor-internal measurement after multi-agent review was deployed | Multi-agent review raised real review coverage | Single organisation; process change, not model capability, drove the gain |
| Average security pass rate 56%; ~44% of tasks produced known vulnerabilities | Veracode summer 2026 [12] | Static analysis of model outputs, 100+ models | Model output security is roughly flat year on year | Raw models without agent guardrails; a lower bound, not a pipeline verdict |
| Pass rate ~55%, XSS 15%, log injection 13%; syntax rose ~50% → ~95% | Veracode spring 2026 [13] | Static analysis of model outputs, 150+ models | Syntactic competence doubled while security did not move | Same raw-model caveat; two-year window, single vendor's test suite |
| 42% of committed code AI-generated; 96% do not fully trust it; 38% say AI code is harder to review | Sonar 2026 [14] | Survey of 1,149 respondents | Trust deficit and review burden are measured by the practitioners | Self-report; verification behaviour is stated, not observed |
| 66% use assistants or agents; only 6.6% trust AI including for important work decisions, and a further 16.3% trust it for many tasks but not for important ones | Stack Overflow Developer Survey 2026 [15] | Survey, more than 30,000 participants | Adoption is broad, institutional trust is not | Respondent pool skews toward active developers |
| ~95% of generative AI pilots fail | MIT Media Lab NANDA report [16] | 52 interviews, 153 survey responses, not peer-reviewed | The headline rests on a denominator switch across a funnel | Success rate among actual pilots is ~25%; authors sold agentic products [16][17] |
| ~75% of new code at Google is AI-generated and engineer-approved | Secondary press on a Google Cloud executive post [18] | Vendor statement reported second-hand | Direction of travel at one large organisation | Not a study; primary source is an executive post, not measurement |
What to carry forward
Three conclusions survive the audit. First, the evidence for AI-assisted development is genuinely positive on output volume and genuinely weak or negative on everything that happens after the code is written, and the two facts belong in the same sentence. Second, the stagnation in code security is not a capability problem that better models will solve on their own schedule; it is a specification problem, solved by infrastructure that makes the intended safety property executable and checkable. Third, the most valuable number in this ledger is not a productivity figure but Anthropic's measured recovery of review coverage from 16% to 54% once multi-agent review was deployed with a price on false positives — a change that came from process design, not from a model release.
The consequence for a technology leader is a reordering of attention. Writing code was never the scarce resource in a well-run engineering organisation. Reading it, trusting it, and being accountable for it are. The bottleneck has moved, and the next article in this series looks at where it landed and what it costs to operate there.
In this series: Previous — SDLC to ADLC: What the Viral Diagram Leaves Out · Next — Where the Bottleneck Moved: Code Review After Coding Agents
Sources
- METR, "Early 2025 AI experienced OS dev study", July 2025 — https://metr.org/blog/2025-07-10-early-2025-ai-experienced-os-dev-study/
- METR, "Uplift update", February 2026 — https://metr.org/blog/2026-02-24-uplift-update/
- DORA, State of DevOps 2024 — https://dora.dev/research/2024/dora-report/
- DORA, "2025 State of AI-assisted Software Development" announcement, September 2025 — https://cloud.google.com/blog/products/ai-machine-learning/announcing-the-2025-dora-report
- DORA, "ROI report", 2026 — https://dora.dev/ai/roi/report/
- DORA, "Finding balance in the era of tokenmaxxing" — https://dora.dev/insights/finding-balance-in-the-era-of-tokenmaxxing/
- Microsoft rollout study, arXiv:2607.01418, 1 July 2026 — https://arxiv.org/abs/2607.01418v1
- Faros AI, "AI Acceleration Whiplash", 2026 — https://www.faros.ai/research/ai-acceleration-whiplash
- Faros AI, "AI software engineering" 2025 wave analysis — https://www.faros.ai/blog/ai-software-engineering
- LinearB, "Software Engineering Benchmarks Report" — https://linearb.io/resources/software-engineering-benchmarks-report
- Anthropic, "How Anthropic secures its AI-native software development lifecycle" (vendor self-report) — https://claude.com/resources/articles/how-anthropic-secures-its-ai-native-software-development-lifecycle
- Veracode, "2026 GenAI Code Security Report", summer 2026 — https://www.veracode.com/blog/2026-genai-code-security-report-ai-risk and https://www.veracode.com/news/llms-are-getting-smarter-but-not-safer-veracode-2026-genai-code-security-report-finds-ai-generated-code-security-has-stalled-at-56%25-pass-rate/
- Veracode, "Spring 2026 GenAI Code Security" — https://www.veracode.com/blog/spring-2026-genai-code-security
- Sonar, "2026 State of Code: critical verification gap in AI coding", press release dated 8 January 2026 — https://www.sonarsource.com/company/press-releases/sonar-data-reveals-critical-verification-gap-in-ai-coding/ Survey sample: 1,149 respondents — https://www.sonarsource.com/the-state-of-code/developer-survey-report/
- Stack Overflow, "The results of the 2026 Developer Survey are here", 6 October 2026 — https://stackoverflow.blog/2026/10/06/the-results-of-the-2026-developer-survey-are-here/ The exact survey figures are on the primary source: https://survey.stackoverflow.co/2026/ and https://survey.stackoverflow.co/2026/ai/
- Fortune, "An MIT report that 95% of AI pilots fail spooked investors", 21 August 2025 — https://fortune.com/2025/08/21/an-mit-report-that-95-of-ai-pilots-fail-spooked-investors-but-the-reason-why-those-pilots-failed-is-what-should-make-the-c-suite-anxious/ The primary source is the MIT Media Lab NANDA report The GenAI Divide (State of AI in Business 2025): not peer-reviewed, based on 52 interviews and 153 survey responses.
- 80,000 Hours, critical reading of the MIT workplace study — https://80000hours.org/podcast/episodes/ai-workplace-mit-study/
- Sundar Pichai, "Sundar Pichai shares news from Google Cloud Next 2026", The Keyword, 22 April 2026: 75% of all new code at Google is AI-generated, up from 50% last fall — https://blog.google/innovation-and-ai/infrastructure-and-cloud/google-cloud/cloud-next-2026-sundar-pichai/
- Anthropic, "Bringing Code Review to Claude Code" (multi-agent review: substantive comments 16% → 54%, fewer than 1% false positives) — https://claude.com/resources/articles/code-review