The unit of attention in software delivery is the pull request. It is also the unit where waste accumulates. LinearB's 2026 Software Engineering Benchmarks Report covers 8.1 million pull requests from more than 4,800 teams across 42 countries, and it sorts them into three categories: unassisted, AI-assisted, and agentic [1].
One result in that dataset matters more than the others, and it is not a throughput result. At p75, the AI-assisted pull request is 408 lines long. The unassisted pull request at the same percentile is 157 lines. The agentic one is 293 lines [1][2]. Now take review time at that same percentile: 3.2 hours for AI-assisted, 4.2 hours for unassisted, 6.4 hours for agentic [1][2].
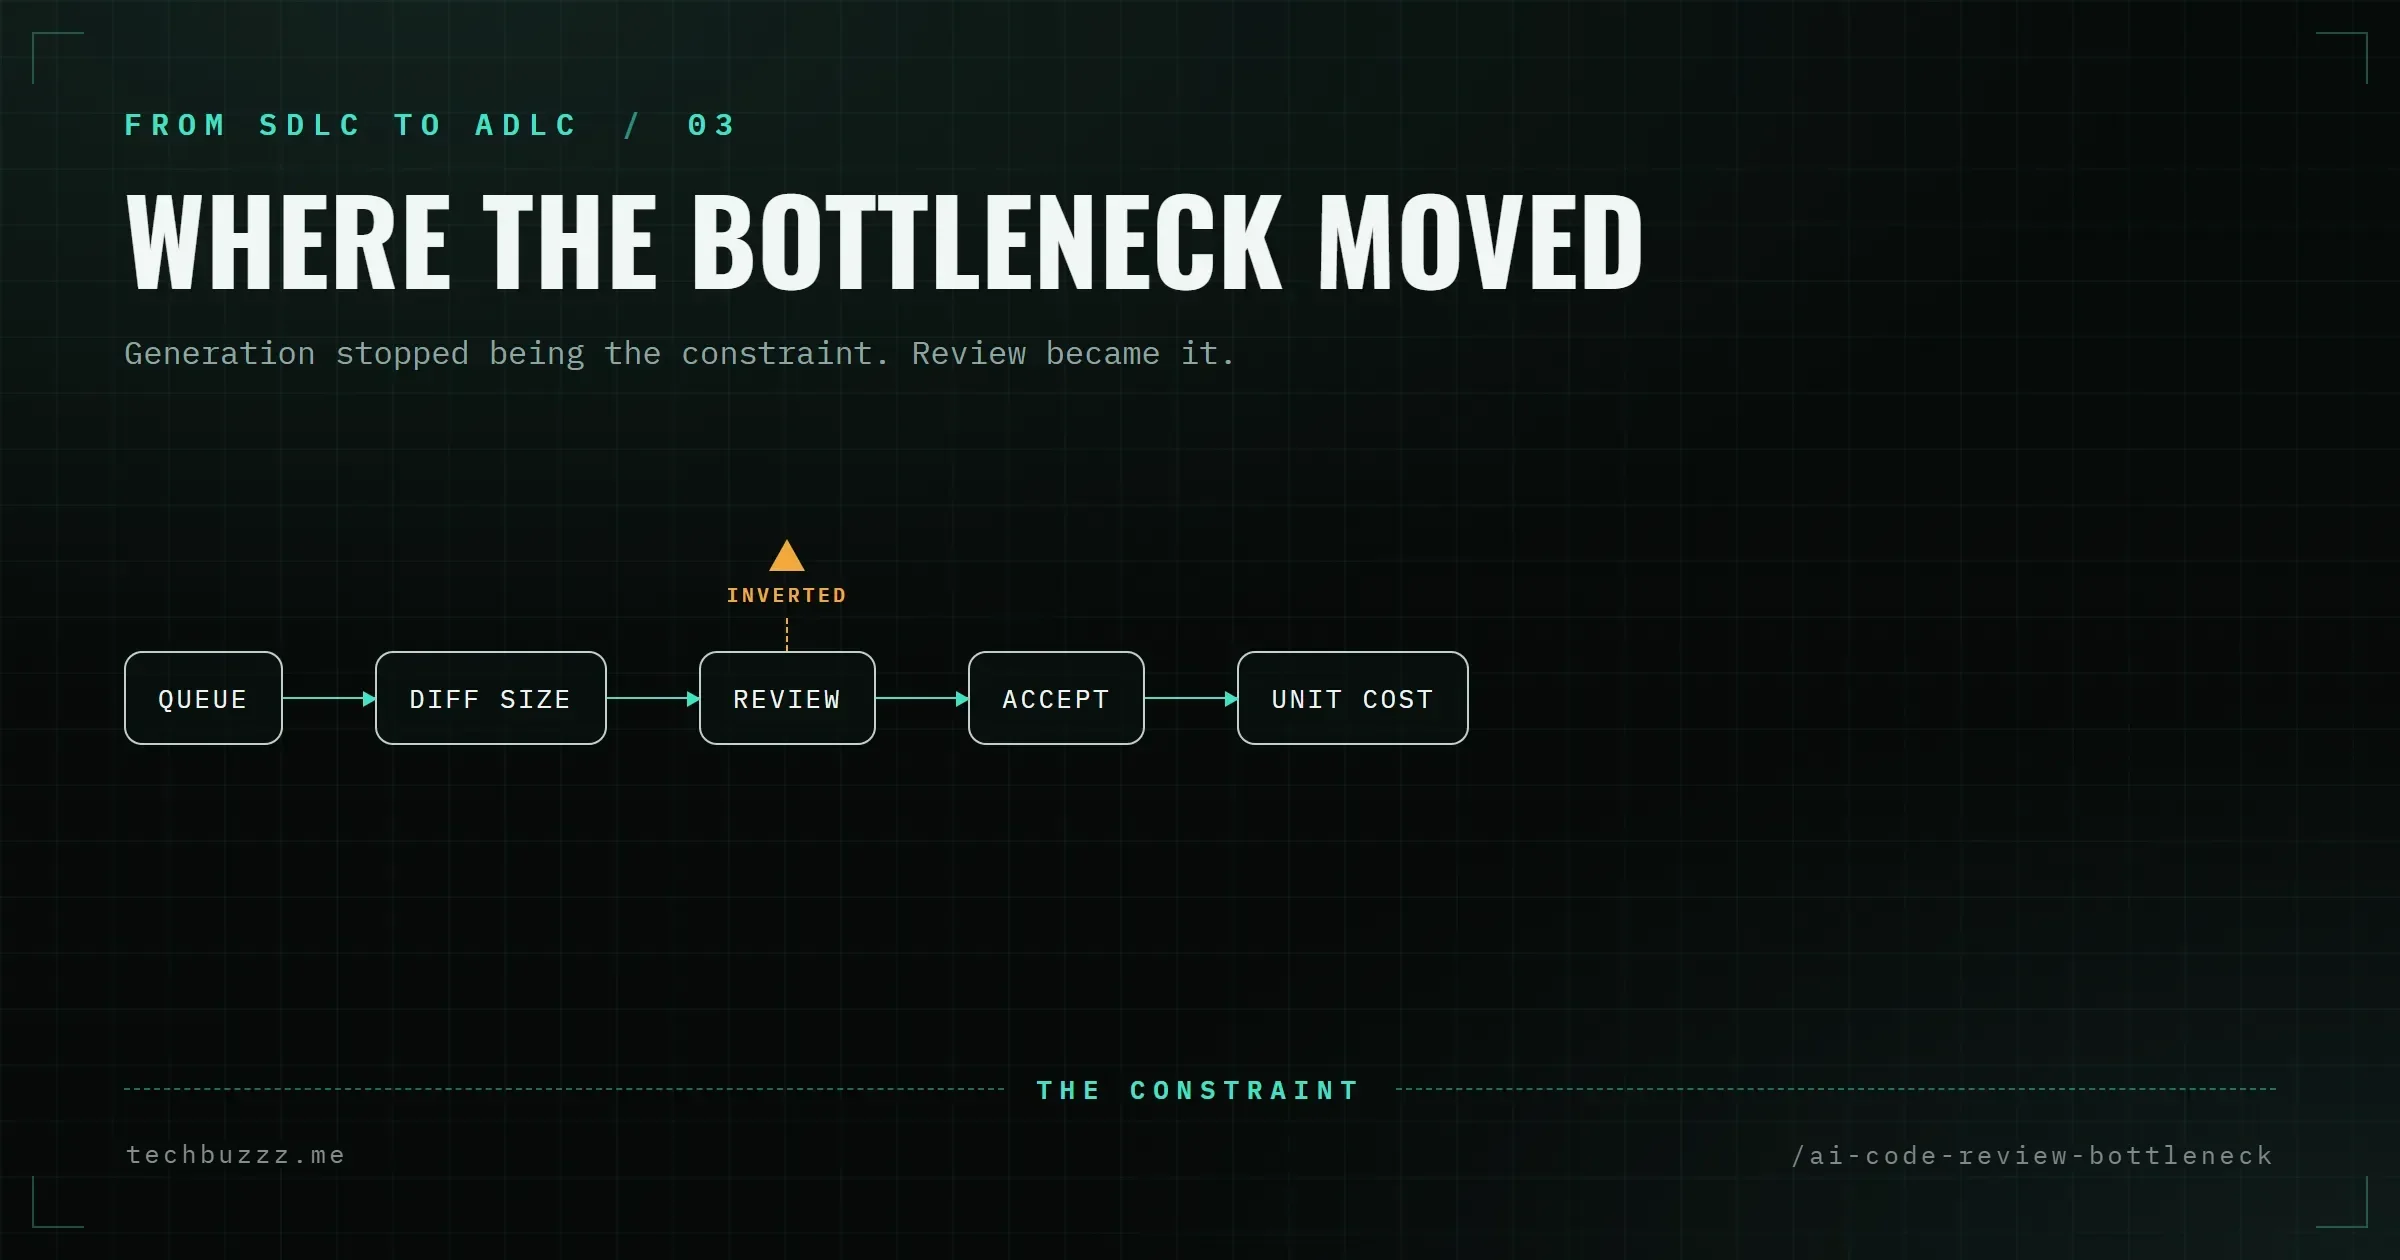
The largest change in the distribution receives less review time than the smallest. A 157-line human diff is looked at for longer than a 408-line assisted diff. Turned around: the change with the most content a reviewer has to verify is the one whose verification gets the least time. Everything that follows in this article is a consequence of that reversal.
It is worth stating plainly what changed and what did not. Code generation stopped being the constraint on delivery. Very few teams are now limited by how quickly a diff can be typed, and that was already partly true before coding agents. What changed instead is the far side of that gain. Pull requests wait longer for a first reviewer, arrive larger, and are accepted far less often. Verification has not kept pace with generation, and in several datasets its coverage fell while volume rose. The queue moved into code review, and the quality of the stage that is now the bottleneck degraded before its capacity grew.
Amdahl's law, applied to a delivery lifecycle
Amdahl's law is old and uncontroversial: however much you accelerate one part of a process, the total speedup stays bounded by the share of that process you did not accelerate. Applied to software delivery in 2026, the unaccelerated share is not typing. It is everything around typing — environment setup, CI, review, merge, verification — and that share was already dominant before coding agents and is now larger still. Generation is no longer the term that governs the cycle.
Anthropic applies the law to their own engineering organisation, in a vendor self-report. They state that Claude authors roughly 80% of merged code and that they ship 8× more code per quarter than during 2021–2025 [11]. They do not present that as a productivity result. They present it as a problem: multiplying code volume by eight changes nothing in a delivery system whose review stage stays sequential and human, so the effort went into identifying the blocking stage and rebuilding it, rather than into distributing more agents across the pipeline [11][12].
That provenance is worth noting. Amdahl's law asserted by a theorist about software engineering is easy to file away as a model. Amdahl's law asserted by an organisation that multiplied its own output eightfold, then reported the gain as worthless until the review stage was rebuilt, is a measurement of the same pipeline the reader is running [11]. It is also the reason this series treats the review stage as an engineering problem rather than a staffing preference.
The queue, measured
The most informative metric an engineering organisation can instrument is time to first review, because it measures the distance between what developers can now produce and what the system can absorb.
LinearB reports that AI-assisted pull requests wait 4.6× longer for a first reviewer than unassisted ones. For agentic pull requests the gap is wider: median time to first review of 17.6 hours against 3.4 hours for unassisted, about 5.25× [1][2].
Then the asymmetry. Once a reviewer picks the change up, AI-assisted pull requests are reviewed 2× faster than unassisted ones [1][2]. The delay is not in the reviewing. It is in everything that happens before the reviewing: noticing, claiming, triaging, and getting to the head of someone else's list.
| Metric | Unassisted | AI-assisted | Agentic |
|---|---|---|---|
| Median time to first review | 3.4 hours | not reported | 17.6 hours |
| Wait for a first reviewer, relative | baseline | 4.6× | ~5.25× |
| Review time once picked up | baseline | 2× faster | not reported |
| Accepted within 30 days | 84.4% | 32.7% | not reported |
The last two rows are where the queue turns back on itself. An AI-assisted pull request is picked up faster than a human one, reviewed faster than a human one, and then accepted within thirty days at roughly a third of the rate [1][2]. Work that enters the system quickly does not leave it.
This is the heart of the argument, and it is not a claim about reviewer skill. Reviewing assisted changes is faster once started. The constraint sits at the intake edge of the pipeline — in human attention deciding what to look at, and in how little of it there is.
The inversion
The table above separates the queue from the attention. Isolating the latter at p75 produces a clean and uncomfortable ordering [1][2]:
| Category | Size at p75 | Size at median | Review time at p75 |
|---|---|---|---|
| Unassisted | 157 lines | 26 lines | 4.2 hours |
| AI-assisted | 408 lines | 96 lines | 3.2 hours |
| Agentic | 293 lines | 89 lines | 6.4 hours |
Attention should scale with the risk a change creates, which is roughly proportional to how much of the system it can alter. Here it does not scale at all. The category with the largest changes, by both median and p75 size, receives the shortest review of the three. The category with the smallest changes receives more review time than that category. The ordinary pull request written by a person with no assistant in the loop is looked at longer than the same person's assisted work.
Two readings are available, and the data does not settle between them. The charitable one is that reviewers are correct: assisted changes are more uniform, more legible, and genuinely cheaper to verify than the messy diffs humans produce when nobody has constrained them. The uncomfortable one is that the queue described in the previous section has imposed a budget — intake slowed, so attention per change is rationed — and that rationing falls on the changes that need it most, because the diffs a reviewer can skim are precisely the diffs that survive being skimmed. The 32.7% acceptance figure for AI-assisted work is consistent with either reading [1][2].
What happens downstream
Microsoft's mandatory rollout study, published as arXiv:2607.01418 on 1 July 2026, follows tens of thousands of engineers across four months. It is observational rather than randomised, and that constraint should travel with every number in this section [3]. Adopters merged roughly 24.0% more pull requests per engineer per day (95% CI +14.5% to +33.7%) [3]. In the cohort breakdown the lift is 11.4% for Claude Code users (95% CI +9.4% to +13.6%) and 24.9% for Copilot CLI (95% CI +23.0% to +26.8%), reaching 50.1% for engineers using Claude Code for five or more days [3]. The study contains no CI-time metric: 14.5% to 33.7% is a confidence interval on the lift, not a build delay. A separate cut of the same study is the dose-response: the lift was 15.0% at three days of Claude Code use and 50.1% at five or more days [3]. None of these figures describes the share of output that went through review — and that is exactly what a business case built on merged pull requests is missing.
Faros AI's 2026 Acceleration Whiplash study covers 22,000 developers across more than 4,000 teams, and it measures movement within each organisation from low to high AI adoption. Comparing an organisation against its own earlier state is stronger than a cross-company comparison and still not causal.
| Metric | Acceleration Whiplash 2026 | Productivity Paradox, earlier wave |
|---|---|---|
| Throughput | +34% tasks per developer | +21% tasks |
| Merged output | +66.2% epics per developer | +98% pull requests |
| Median time in PR review | +441% | +91% |
| PR size | +51.3% | +154% |
| Bugs per developer | +54% | +9% |
Throughput rose 34% on tasks and 66.2% on epics per developer [4]. The earlier wave, covering more than 10,000 developers and 1,255 teams, recorded a smaller version of the same shape: +21% tasks, +98% pull requests merged, review time +91%, PR size +154%, bugs per developer +9% [5]. What makes the 2026 figures notable is not the magnitude of the review-time increase but its reach. Faros reports that the deterioration appears regardless of baseline engineering maturity, and that organisations with strong pre-AI engineering performance were not insulated [4]. The usual explanation — that these teams had weak processes and AI merely exposed the weakness — does not survive that finding. Good process was not the protective factor.
Verification tax and instability tax
DORA's 2026 ROI report names the mechanism behind a temporary dip in productivity, and its framing is more useful than the usual productivity framing because it separates what will heal from what will not. The report describes a J-curve: a decline followed by recovery, attributed to three causes — the learning curve, the verification tax, and pipeline adaptation — and it calls the total the "tuition cost of transformation" [6][7].
The verification tax is the term this article is about. It is the cost of checking work that could previously be taken on trust. It scales with the number of changes rather than with the number of developers, and it does not amortise the way a learning curve does: the third time a reviewer reads an unfamiliar agent-generated diff, they are no more able to skip it. The worked instability-tax example in the same report is $344,000 of negative downtime impact from a move in change failure rate from 5% to 6% [6][7]. One percentage point, at one organisation, is a six-figure line item.
DORA's earlier wave is consistent with the dip being real and recurring. A 25% increase in AI adoption was associated with a 7.2% reduction in delivery stability and a 1.5% reduction in throughput [8]. The 2025 State report, surveying roughly 5,000 professionals, found 90% using AI at work, 30% reporting little or no trust in generated code, a positive relationship with throughput and a still-negative one with stability [9].
Developer sentiment points the same way, and it matters more than vendor surveys because it describes behaviour rather than stated preference. Sonar's 2026 research across 1,149 respondents found that 96% do not fully trust AI-generated code, that only 48% always verify before committing, and that 38% report reviewing AI code takes more effort than reviewing a colleague's [14]. Stack Overflow's 2026 Developer Survey, with more than 30,000 participants, found only 6.6% trust AI including for important work decisions, and a further 16.3% trust it for many tasks but not for important ones, rising to roughly 48% when the output is easy to verify [15]. Both distributions describe the same structural condition: trust is conditional on verifiability, and verifiability is exactly what the pipeline is no longer reliably providing.
Why hiring reviewers does not remove a constraint
The obvious remedy is to hire reviewers. The theory of constraints says this does not work, and it says why in one sentence: a system's throughput is governed by its constraint, and adding capacity anywhere else relocates the queue rather than shortening it.
Bill Staples, CEO of GitLab, states the economics directly in "When code is abundant" (24 August 2026). The correct unit is cost per accepted change, aggregating generation, environment setup, context, verification, review, remediation and governance [10]. AI collapses the generation term and leaves every other term in place, which makes each of the others proportionally heavier in the total. An organisation that makes generation ten times faster while leaving CI, review and validation untouched, in his formulation, "will not become ten times faster. It will simply move the queue" — and he names the theory of constraints as the reason [10].
The measurements support the formulation. Merged pull requests in the Microsoft rollout rose by about 24.0% (95% CI +14.5% to +33.7%) — the study contains no CI-time metric [3]. The environment and pipeline terms are not fixed costs that stay flat while generation accelerates; they grow with volume. Adding review headcount addresses a single term in that denominator while the volume feeding it rises.
Cost per accepted change also reorders priorities in a way that pull request throughput does not. Under a throughput metric, 32.7% acceptance at high volume reads as a reasonable trade. Under cost per accepted change the picture differs: agentic pull requests merge within 30 days in only 32.7% of cases, against 84.4% for unassisted work [1]. No amount of generation-side efficiency touches that.
What this implies for how you staff engineering
Two findings sit next to each other and do not resolve easily. Reviewing an AI-assisted change is faster than reviewing a human one once a reviewer has started [1][2]. And 38% of developers report that reviewing AI code takes more effort than reviewing a colleague's [14]. Both can hold at once: a reviewer who knows what to expect moves faster, and a reviewer who does not spends longer. The variable is not the diff. It is the reviewer's model of what the diff is supposed to do — and at p75 that model is being formed under time pressure, on the largest changes in the distribution, in a queue where a human reviewer arrives last [1][2].
The organizational consequence is separation of duties. The author of a change and the acceptor of that change should not be the same party once the artifact cannot be taken on trust. That principle is not new. What is new is the speed at which breaking it becomes convenient. Microsoft's data shows merged pull requests up 24.0% (95% CI +14.5% to +33.7%) across tens of thousands of engineers, while the share of output that went through review was not measured at all [3] — and that is not a policy decision, it is capacity running out ahead of governance.
Restoring coverage has to be cheaper than human attention or it will not be adopted. Anthropic reports, in a vendor self-report, that after multi-agent review was deployed into the pipeline the share of pull requests receiving substantive comments rose from 16% to 54%, with fewer than 1% false positives [11]; a separate vendor account describes the other side of the same change — new review agents ran in shadow mode, so a human confirmed their findings before they reached a report [12]. Note what the fix was. Not more agents, but a burden of proof imposed on each finding, which made cheap review cheap enough to run at volume.
That is as far as this article goes. Staffing models for this problem are a separate problem, and this is where the series stops theorising and starts building.
What the data does not show
The direction of this evidence is consistent; the magnitudes are not comparable. That distinction should be explicit, because the temptation in a piece like this is to treat a pile of studies as one finding rather than as separate observations that happen to point the same way.
First, none of it is randomised. The Microsoft rollout is observational, and a mandate introduced at a known time is not an experiment: teams that adopted quickly may differ systematically from teams that adopted slowly. DORA's 2024 result is an association across organisations at different adoption levels. Faros compares each organisation against itself over time, which controls for the codebase but not for concurrent process changes, hiring, or product pressure.
Second, the categories are not standardised. "Agentic" and "AI-assisted" mean different things in LinearB, in Faros, and in the arXiv study. Directions agree across them; magnitudes do not transfer. A 441% rise in median review time and a 4.6× wait for a first reviewer are not two measurements of one quantity.
Third, the inversion is a distributional statement, not a causal one. It describes what happened to the largest quartile of changes in aggregate. It does not show that any individual reviewer under-reviewed any individual change, and it says nothing about defect density in any specific set of changes.
Fourth, two of the clearest illustrations are not independent measurement. Anthropic's figures are a vendor self-report about its own systems [11][12]. The Stripe material is a secondary account [13]. Both are included because they describe mechanisms rather than because they carry statistical weight.
Fifth, none of this shows that review quality itself collapsed. It shows that review coverage fell, review time per change fell, acceptance fell, and rework rose. Defect escape rates are harder to observe and largely absent from this evidence base; the DORA instability-tax example is the closest available proxy [6][7].
Sixth, none of it identifies the shape of the fix. That is deliberate.
The infrastructure question
The problem now has a name: not code generation, but verification capacity. Every dataset in this article points at the same stage, and none of them suggests that stage is constrained by reviewer intelligence. It is constrained by reviewer availability, by the evidence a reviewer has to work from, and by the cost of checking work that is produced faster than it can be checked.
Stripe's Minions is the clearest published example of what that capacity looks like when it was built before the agents arrived. In a secondary account, the agent inherits a verification system built for humans: more than three million tests, a maximum of two CI iterations per run after which the branch returns to a human, execution in isolated pre-warmed environments, and roughly 500 centrally served internal tools. Agent pull requests run at 1,000+ per week at first disclosure and 1,300+/week as of February 2026, all human-reviewed [13]. The agent does not decide whether to lint. The system does not permit the question.
That is what an artifact chain is: verification capacity materialised as build systems, test suites, isolated environments and centrally served tooling, all of which exist whether a human or an agent produced the change. The point is not that every team should write three million tests. It is that the verification stage has to be a system with its own capacity, its own abstractions and its own failure handling, rather than a person reading a diff that is now 408 lines wide, hours after it was written [1][2].
That is the next question in this series, and it is an engineering question rather than a hiring one.
In this series: Previous — The AI SDLC Hype Ledger: What the Evidence Actually Shows · Next — The Infrastructure an ADLC Actually Requires
Sources
- LinearB — 2026 Software Engineering Benchmarks Report — 8.1M pull requests, 4,800+ teams, 42 countries. The detailed metrics are in the report PDF, available by registration.
- LinearB Library — AI in software development — category-level size, review-time and acceptance figures.
- Microsoft AI rollout study, arXiv:2607.01418v1 — observational study of a production AI mandate, 1 July 2026.
- Faros AI — Acceleration Whiplash 2026 — 22,000 developers, 4,000+ teams.
- Faros AI — The AI Productivity Paradox — earlier wave, 10,000+ developers, 1,255 teams.
- DORA — 2026 AI ROI report — J-curve, verification tax, instability-tax worked example.
- InfoQ — DORA ROI report on AI-assisted development — secondary coverage of the 2026 DORA ROI report.
- DORA — State of DevOps 2024 — 2024 wave: AI adoption and delivery stability.
- Google Cloud — Announcing the 2025 DORA report — State report 2025, roughly 5,000 professionals.
- GitLab — When code is abundant — Bill Staples, 24 August 2026; cost per accepted change.
- Anthropic — How Anthropic secures its AI-native software development lifecycle — vendor self-report. The "16% → 54% substantive review comments" result comes from a separate Anthropic post: https://claude.com/resources/articles/code-review
- GitLab — Securing the software factory at machine speed — Chaim Mazal, 18 September 2026; vendor self-report on pipeline security, shadow mode for review agents, and time from detection to verified remediation.
- Stripe Minions — secondary research write-up — secondary source on inherited verification infrastructure. Stripe primary source: https://stripe.dev/blog/minions-stripes-one-shot-end-to-end-coding-agents
- Sonar — Critical verification gap in AI coding — Sonar 2026, press release dated 8 January 2026. Survey sample: 1,149 respondents — https://www.sonarsource.com/the-state-of-code/developer-survey-report/
- Stack Overflow — The results of the 2026 Developer Survey — more than 30,000 survey participants. The exact survey figures are on the primary source: https://survey.stackoverflow.co/2026/ and https://survey.stackoverflow.co/2026/ai/